Sign up for our free daily newsletter
Get the latest news and some fun stuff
in your inbox every day
Get the latest news and some fun stuff
in your inbox every day
A trading update from Kumba Iron Ore on Friday looked weak, but once again this is as a result of the same factors that we were referring to above, a slowing European economy which is resulting in a global slowdown. As Byron often says, if someone does not need a new washing machine in Spain or Italy, and the goods are manufactured in China, well, that means less business for the Chinese. And that means less demand for the raw products too. ALTHOUGH, the internal consumption story in China is one that still continues to impress the pundits, or so I am led to believe. China still has a relatively unbalanced economy. But back to this main story, Kumba Iron Ore expect earnings for the first six months of the year to clock 7.1 to 7.5 billion Rands, which on a per share basis is between 22.10 ZAR to 23.40 ZAR. Which on balance sounds good, and the share price is acceptable at 559 ZAR a share, bearing in mind that the distributions have been amazing. The payout ratio in recent years has been around 80 percent of earnings.
The first six months of last years' earnings clocked 28.20 ZAR per share, so we are going to see a comfortably lower set of earnings relative to that period. The full year number last year was 53.13 ZAR a share (24.93 for the second half), with 44.2 ZAR paid out to shareholders by way of dividends, including Anglo American who are a nearly two thirds shareholder. The reason for the lower earnings are explained in a simple one liner and are "largely attributable to a decrease in export iron ore prices in the period". I have been watching the monthly change at the SA ports, and the key one (as far as Kumba Iron Ore is concerned) to watch here is Saldhana Bay, where the volumes have been growing. Indicating that the volumes should be slightly higher, remember that in the second half of the year last year, production fell. What is different this year is that the newly "opened" Kolomela mine, which should produce between 4-5 million tons per annum this year and 9 million tons per annum from next year, 2013. Total sales last year were 43.5 tons, it will possibly be the number to watch.
But I thought, let us check out a five year iron ore pricing graph to see what Kumba Iron Ore are talking about, which I sourced from here: Iron Ore Monthly Price - US Dollars per Metric Ton. Here is the graph, which just shows the highs and lows and recent price.
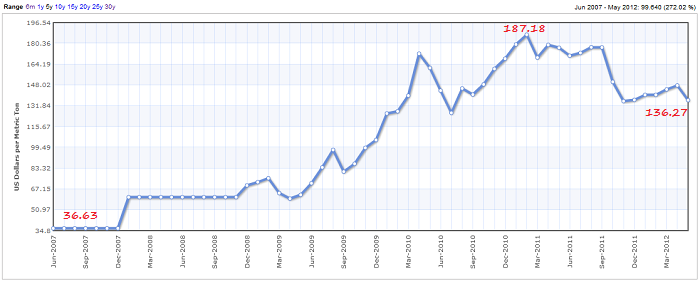
These prices are average monthly prices and are perhaps a blended price of the spot market and the contract prices. You can see at the bottom left, the prices were set annually by the majors in a negotiated settlement with the steel companies. And then everyone kind of set that as the benchmark. I was trying to do a simple back of the matchbox type iron price, with the first six months of last year seeing an average price of 177 odd Dollars per ton. For the six months just past the price is roughly 20 percent lower at 141 Dollars per ton, that was the simplest calculation that I could do. Helping Kumba out would be the weakening Rand to the US Dollar. The results are expected to be released around the 20th of July.